

A three parts series to cover anomaly detection using Elasticsearch and Kibana. My goal is to provide a digestible introduction to anomaly detection without diving too deep into data science. I'll guide you through creating your first anomaly detection job through Kibana then adding alerts on top. Hoping to excite you to explore the incredible ML capabilities of the Elastic stack.
Part 1: Get started with anomaly detection (you're here)
Part 2: Create your first anomaly detection job (coming next week)
Part 3: Add alerting to your ML jobs (coming later)
Not so long ago, machine learning (ML) and applications like anomaly detection were only accessible to ML specialists and seasoned data analysts. Lucky for us, solutions like Elasticsearch and Kibana allow data professionals and engineers to gain unique insights from their data through ML quickly and with ease.
I've recently read the book Machine learning with the Elastic Stack, the main driver for writing this series. I highly recommend reading this book if this article piques your interest as it goes into great detail explaining Elastic's ML capabilities, configurations, and applications in practice.
Entering anomaly detection
Anomaly detection is simply a way to find data points or patterns in your data that are different from usual. There are two heuristics that we could use to define the different kinds of anomalies:
- Temporal: Something is unusual if its behavior diverges significantly from an established pattern in its own behavior over time.
- Population: Something is unusual when it is drastically different from its peers in population.

Elasticsearch uses unsupervised learning to detect anomalies in the data. The gist of unsupervised learning is that the algorithms learn the data patterns independently with no outside guidance or assistance from humans, which is a massive win for us!
Why you should care
It is not uncommon to see companies handle terabytes of critical information through continuous data streams from their solutions. Examples of such data vary from things like purchase logs, user interactions, and all the way to system logs and network activity.
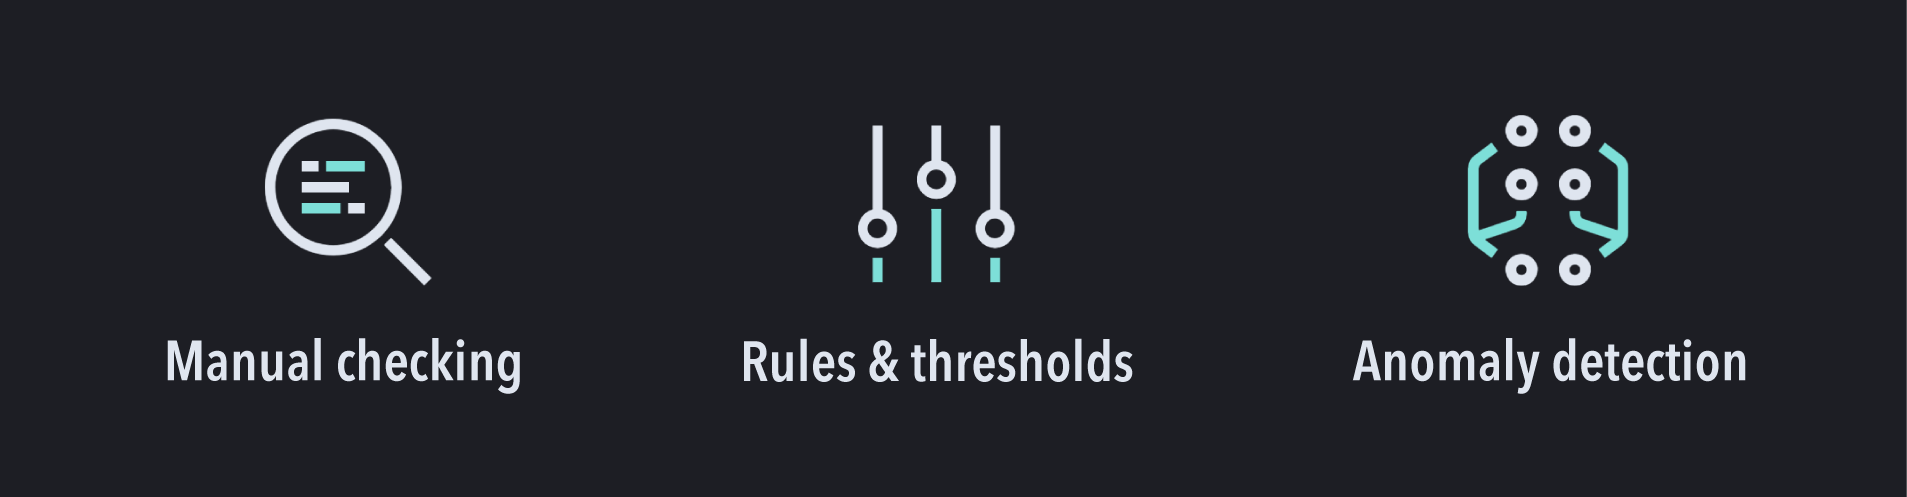
In general, there are three main approaches to sifting through this plethora of data:
- Manually watch the data looking for anomalies through visualizations and analyses.
- Define rules or conditions to trigger under specific requirements.
- Use Machine learning to detect anomalies in data and proactively take action.
It goes without saying that manually watching incoming data to detect issues proactively is both costly and error-prone. A less obvious fault of this approach is that a human eye cannot detect all anomalies. There are a few key things to recognize about these less-than-obvious anomalies:
- A pattern is not anomalous by itself but is interestingly significant.
- Lack of expected values can be anomalous if there's an expectation that events should occur.
- An anomaly spans multiple entries rather than a single data point. These are called multi-bucket anomalies.
Setting Thresholds or rules to catch anomalies proactively is a lot better than manual labor. However, it is unlikely to define the entire ruleset needed to get reliable and accurate results. Plus, the velocity of changes in the applications and environments could quickly render any static ruleset useless. Analysts find themselves chasing down many false positive alerts, setting up a boy who cried wolf paradigm rendering the generated results useless.
Using anomaly detection enables teams to act proactively on early signs only surfacing a small set of relevant data points to help in the identification of the root cause while filtering out the noise of irrelevant behaviors that might distract human analysts from the things that actually matter.
Detecting anomalies through the Elastic stack is fast, scalable, accurate, low-cost, and easy to use.
Many important use cases revolve around detecting anomalous events over time (temporal anomalies), such as:
- Detect an unusual purchasing behavior of specific customers or a sudden change in overall sales.
- Proactively detect unexpected piling up of messages in application log files.
- Track down unauthorized access attempts or suspicious user activity.
Finding outliers in a dataset (population anomalies) is critical in several applications such as fraud detection or detecting defects in manufacturing lines.
How does it work?
Anomaly detection works on live data streams by ingesting time series data grouped into discrete time units called buckets. The model allows users to specify a detector function such as average or sum, computed on each bucket. The model then calculates the probability distribution of each bucket and continuously updates this distribution as more data is ingested. The model scores the data points based on their probability distribution. The lower the probability of the data points, the more likely it'll be flagged as an anomaly.
A rather complex orchestration occurs to enable the ML models to continuously ingest and learn from live data streams. Elasticsearch automatically handles all the complex logistics required to make it all happen, from maintaining the model states to data ingestions and managing the cluster.
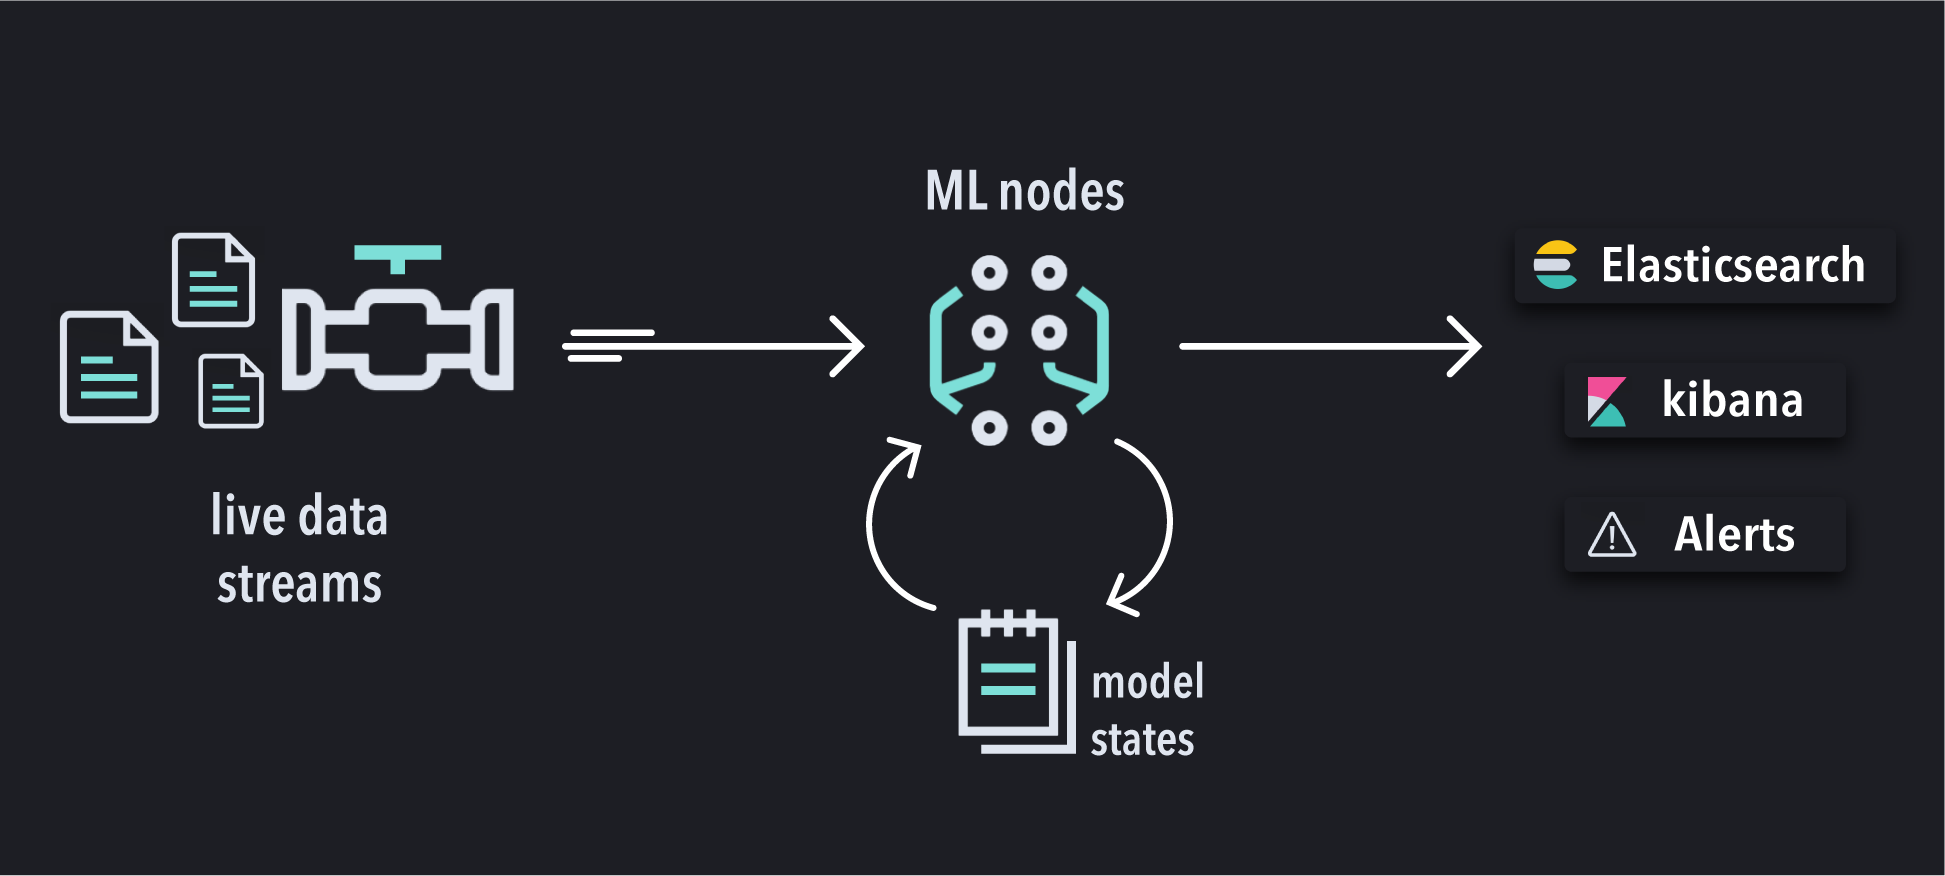
The machine learning nodes in Elasticsearch are responsible for running the anomaly detection jobs, which analyze the incoming data against the ML model. While the models keep their state in memory, snapshots of the latest states are also synced into Elasticsearch. This allows users to revert a job into a previous state in case something unexpected happens. The analysis results are stored in Elasticsearch to be consumed by Kibana or through API access.
The anomaly job model comes with many powerful out-of-the-box features that are also highly configurable. I'll highlight a few here:
De-trending: Elastic’s ML models automatically factor out trends in the data such as linear and cyclical patterns. De-trending is essential for modeling real-world datasets to account for seasonal cycles and linear growth and shrinkage.
Splitting jobs: Elastic’s ML allows splitting the analysis based on categories in the data. Splitting jobs helps the model find more detailed patterns in each category and run the analysis for each in parallel.
Influencers: Elastic ML automatically identifies relevant fields in the dataset that have contributed significantly to anomalous behavior.
Final thoughts
There are many more exciting details and advanced configurations Machine learning with the elastic stack goes into detail about elastic's ML capabilities in both supervised and unsupervised learning.
 Visit Amazon’s Rich Collier Page
Next week I will publish the second part of this series: Create your first anomaly detection job: a step-by-step guide to write your first anomaly job through Kibana within 15 minutes! Stay tuned and follow to get notified.